Statistics Tutorial
Statistics Basics
data types in histogram
- histogram. in statistics or probability chart, the histogram, there are several interpretation of the char's column values and height. the different data sets may be: data sample, population, probability distribution.
- population (statistics) means the data set of all.
- sample (statistics) means a subset of population. (usually randomly selected)
- data set (statistics) means a set of numbers. e.g. [65 98 10 580]. Or each can be a pair, such as age and income e.g. [ [28, $77], [30, $40 ],[42, $27 ], [81, $33 ] ], or name and age e.g. [[jon, 65], [mary, 54], [joe, 565]]
- probability distribution is a set of pairs of numbers. usually a event lable, and its probability e.g. throw dice, each pair [total, probability].
Central tendency
these are numbers to represent some kinda of middle, common value, or average.
- Arithemetic mean. usually written as μ. is the average. i.e. sum of the values of each event, divided by total count of possible events.
- Median. middle value separating the greater and lesser halfs of a data. Median of [1, 3, 3, 6, 7, 8, 9] is 6. Median of [ 1, 2, 3, 4, 5, 6, 8, 9] is (4+5)/2. The data set must have an order. Used only for 1-dimensional data. Median
- mode. Most frequent value in a data set. e.g. 2 is the mode of [1, 2, 2, 3, 4, 7, 9]. Used only for 1-dimensional data.
Measure of Variation
- deviation (of an event) is the difference between the event value and the arithemetic mean. (if x is value of an event, m is mean, then deviation = x-m.) Deviation (statistics)
- Squared deviation from the mean (SDM) (for an event) is square of the deviation of the event. (if x is value of an event, m is mean, then squared deviation = (x-m)^2.) Squared deviations from the mean
- Variance, is the average of SDM. variance is usually denoted σ^2. (if x is value of an event, n is number of events, m is mean, σ^2 = (Sum[(x - m )^2, {x,1,n}])/n.)
- Standard deviation (usually denoted σ), is square root of variance.
i.e.
Sqrt[ (Sum[(x - mean)^2, {x,1,n}]) /n ]
There is also Sample Standard deviation, which instead of divided by n, divide by (n-1). Standard deviation - the expected value is a generalization of the weighted average. Informally, the expected value is the arithmetic mean of a large number of independently selected outcomes of a random variable. Expected value
- confidence interval Confidence interval
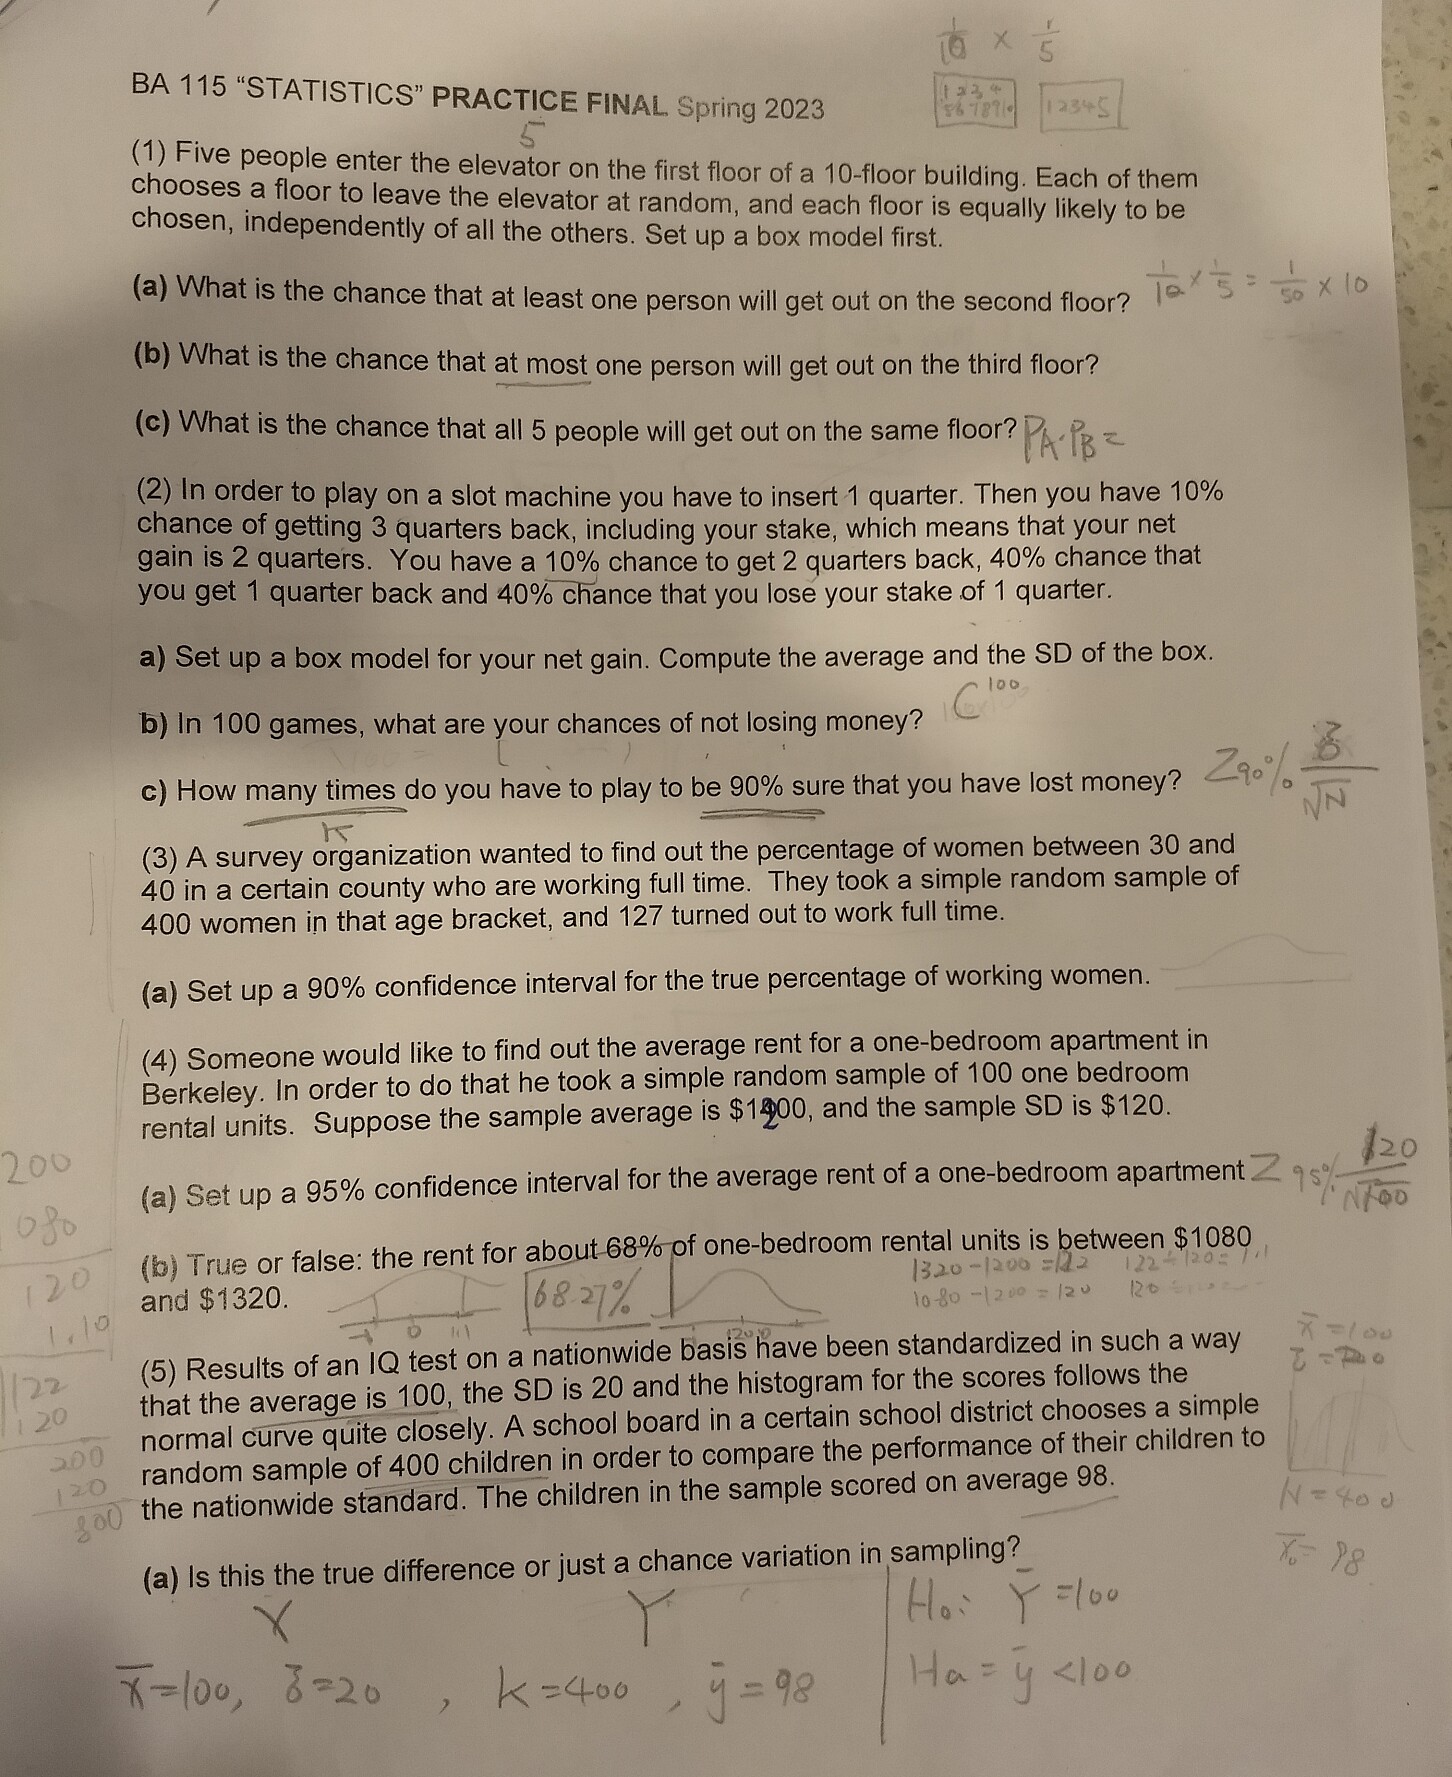
BA 115 "STATISTICS" PRACTICE FINAL spring 2023
(1) Five people enter the elevator on the first floor of a 10-floor building. Each of them chooses a floor to leave the elevator at random, and each floor is equally likely to be chosen, independently of all the others. Set up a box model first.
- (a) What is the chance that at least one person will get out on the second floor?
- (b) What is the chance that at most one person will get out on the third floor?
- (c) What is the chance that all 5 people will get out on the same floor?
(2) In order to play on a slot machine you have to insert M quarter. Then you have 10% chance of getting 3 quarters back, including your stake, which means that your net gain is 2 quarters. You have a 10% chance to get 2 quarters back, 40% chance that you get 1 quarter back and 40%Äance that you lose your stake of 1 quarter.
- a) Set up a box model for your net gain. Compute the average and the SD of the box.
- b) In 100 games, what are your chances of not losing money?
- c) How many times do you have to play to be 90% sure that you have lost money?
(3) A survey organization wanted to find out the percentage ot women between 30 and 40 in a certain county who are working full time. They took a simple random sample of 400 women in that age bracket, and 127 turned out to work full time.
- (a) Set up a 90% confidence interval for the true percentage of working women.
(4) Someone would like to find out the average rent for a one-bedroom apartment in Berkeley. In order to do that he took a simple random sample of 100 one bedroom rental units. Suppose the sample average is $1200, and the sample SD is $120.
- (a) Set up a 95% confidence interval for the average rent of a one-bedroom apartment
- (b) True or false: the rent for abo $80/ f one-bedroom rental units is between $1080 6820 and $1320.
(5) Results of an IQ test on a nationwide basis have been standardized in such a way that the average is 100, the SD is 20 and the histogram for the scores follows the normal curve quite closely. A school board in a certain school district chooses a simple random sample of 400 children in order to compare the performance of their children to the nationwide standard. The children in the sample scored on average 98.
- (a) Is this the true difference or just a chance variation in sampling?
- Statistics, 4th Edition. 2007. by David Freedman, Robert Pisani, Roger Purves. Buy at amazon
worst book. verbose, and written as if you are children, and injects sjw gang stuff like court cases about sjw racism. does not explain the mathematical gist.
Table of contents
- PART I. DESIGNS OF EXPERIMENTS
- Chapter 1. Controlled Experiments
- Chapter 2. Observational Studies
- PART II. DESCRIPTIVE STATISTICS
- Chapter 3. The Histogram
- Chapter 4. The Average Standard Deviation
- Chapter 5. The Normal Approximation for Data
- Chapter 6. Measurement Error
- Chapter 7. Plotting Points and Lines
- PART III. CORRELATION AND REGRESSION
- Chapter 8. Correlation
- Chapter 9. More about Correlation
- Chapter 10. Regression
- Chapter 11. The R.M.S. Error for Regression
- Chapter 12. The Regression Line
- PART IV. PROBABILITY
- Chapter 13. What Are the Chances
- Chapter 14. More about Chance
- Chapter 15. The Binomial Formula
- PAR IV. CHANCE VARIABILITY
- Chapter 16. The Law of Averages
- Chapter 17. The Expected Value and Standard Error
- Chapter 18. The Normal Approximation for Probablity
- PART VI. SAMPLING
- Chapter 19. Sample Surveys
- Chapter 20. Chance Errors in Sampling
- Chapter 21. The Accuracy of Percentages
- Chapter 22. Measuring Employment and Significance Unemployment
- Chapter 23. The Accuracy of Averages
- PART VII. CHANCE MODELS
- Chapter 24. Model for Measurement Error
- Chapter 25. Chance Models in Genetics
- PART VIII. TESTS OF SIGNIFICANCE
- Chapter 26. Tests of Significance
- Chapter 27 More Tests for Averages
- Chapter 28. The Chi-Square Test
- Chapter 29. A Closer Look at Tests of Significance