Stereographic Projection
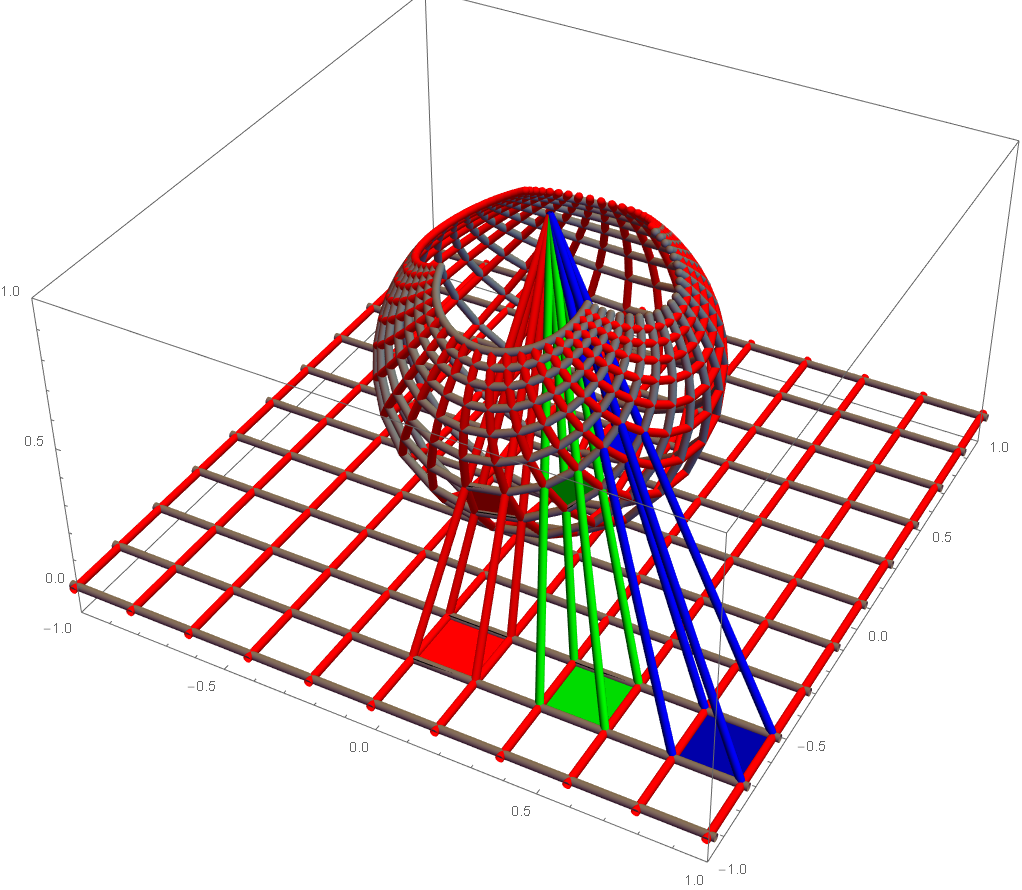
xgridLen = 0.2;
xBoundary = 2;

projectF = ( With[{xx = 1 + #.#}, {#[[1]]/xx, #[[2]]/xx, 1 - 1/xx}] &);

grid2d = Table[{Hue[0], Line[{{x, y}, {x, y + xgridLen}}], GrayLevel[ 0.5 ],
    Line[{{x, y}, {x + xgridLen, y}}]}, {x, -xBoundary, xBoundary, xgridLen}, {y, -xBoundary,
     xBoundary, xgridLen}];

Graphics[grid2d]

grid3d = grid2d /. Line[xpts_] :> Line[(({#[[1]],#[[2]],0}) &) /@ xpts];
Graphics3D[grid3d]

xball = grid2d /. Line[xpts_] :> Line[projectF /@ xpts];

Graphics3D[xball]

Graphics3D[{grid3d, xball}]

sqrCorners = ({{0, 0}, {1, 0}, {1, 1}, {0, 1}} xgridLen) ;

patch2dRed = { Red, Polygon[ ((#+{0, -4} xgridLen) &) /@ sqrCorners ]}
patch2dGreen = { Green, Polygon[ ((#+{2, -4} xgridLen) &) /@ sqrCorners ]}
patch2dBlue = {Blue, Polygon[ ((#+{4, -4} xgridLen) &) /@ sqrCorners ]}
patches2d = {patch2dRed, patch2dGreen, patch2dBlue};

patches3d = (Replace[ {patch2dRed, patch2dGreen, patch2dBlue}, {x_, y_} -> {x, y, 0}, {-2}]);

projLines = ReplaceAll[patches3d, Polygon[pts_] :> Map[ ((Line@{{0,0,1},#}) &), pts]]

projectedPatches = (Replace[ patches2d, {x_, y_} -> projectF@{x, y}, {-2}])

Graphics3D[{grid3d, xball, patches3d }, Axes -> True]

Graphics3D[{grid3d, xball,  patches3d, projLines, projectedPatches }, Axes -> True, PlotRange -> {{-1,1} xBoundary .5 , {-1,1} xBoundary .5 , {-0.1, 1} }]

Graphics3D[{grid3d, xball, patches3d } /. Line -> Tube, Axes -> True]

Graphics3D[{grid3d, xball,  patches3d, projLines, projectedPatches }  /. Line -> Tube, Axes -> True, PlotRange -> {{-1,1} xBoundary .5 , {-1,1} xBoundary .5 , {-0.1, 1} }]
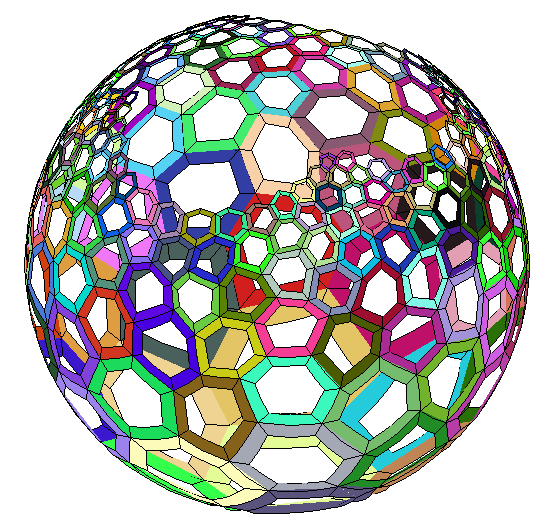
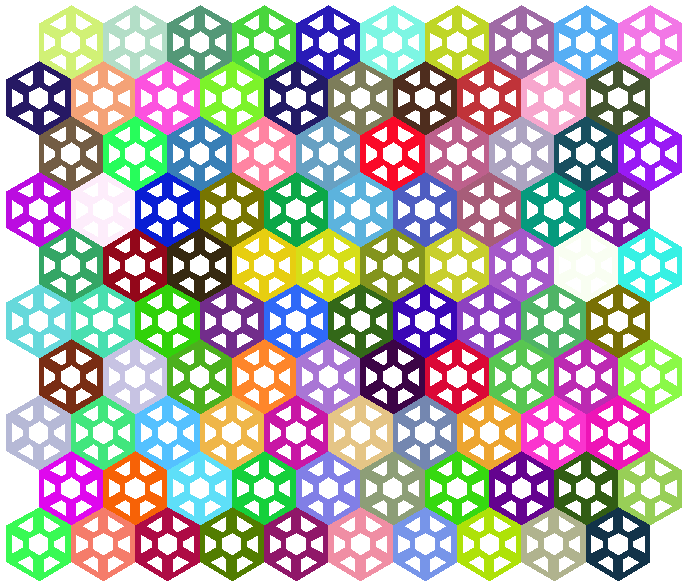
- Suppose you have a ball sitting on a elaborately beautifully tiled floor.
- Now, suppose the top of the ball we call it North Pole.
- Now, Let there be a straight line from the north pole to a point on the floor.
- Call this point P.
- This line will intersect the ball somewhere, let's call the point of intersection Q.
- Now, every point P on the floor will then have a corresponding point Q on the ball.
- This process, of making a image from the floor to the ball is called Stereographic Projection.
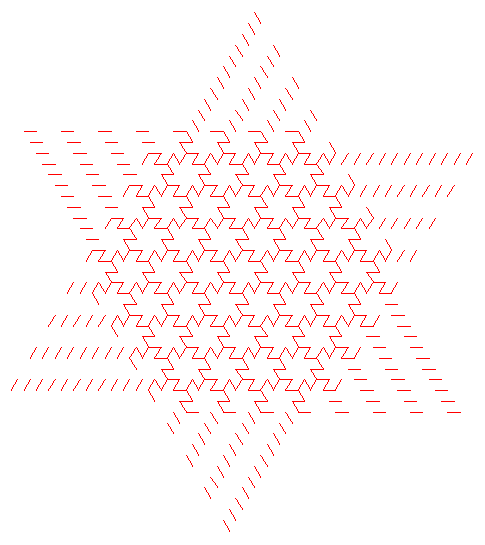
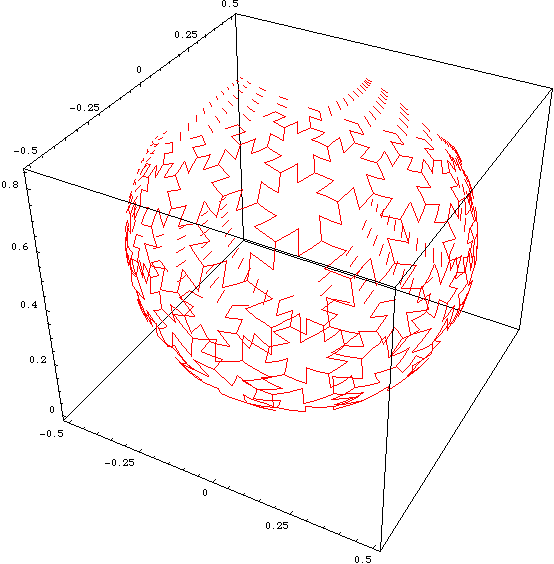
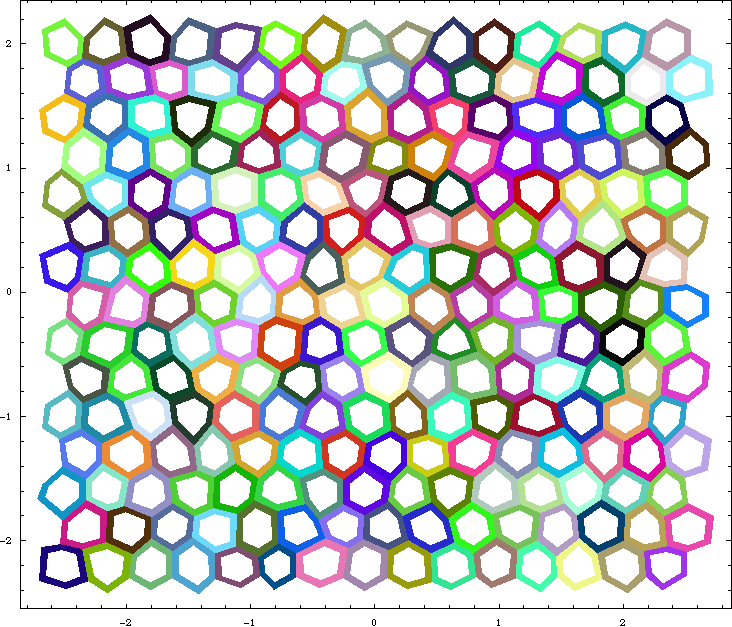
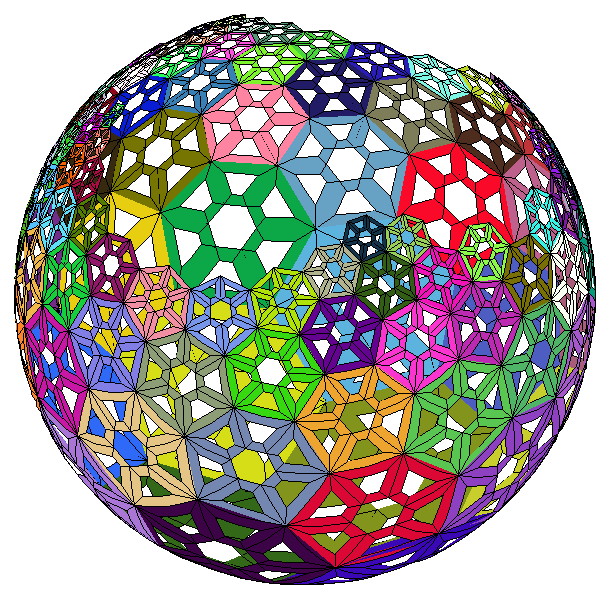
more examples:
Notes
The images on this page is generated by the following Mathematica packages:
- “PlaneTiling.m” available at Plane Tiling Mathematica Package.
- “Transform2DPlot.m” available at Geometric Transformation on the Plane.
- Notebook: sphere_proj.nb
- sphere_proj_illus.nb